Vascular Studies
-
- Thermographic Assessment of a Vascular Malformation of the Hand: A New Imaging Modality.
- Infrared thermal imaging as a novel evaluation method for deep vein thrombosis in lower limbs.
- Digital thermography of the fingers and toes in Raynaud’s phenomenon.
- Vascular surgical society of great Britain and Ireland: analysis of cold provocation thermography in the objective diagnosis of the hand-arm vibration syndrome.
- Detection of dialysis access induced limb ischemia by infrared thermography in children.
- Infrared thermal imaging for detection of peripheral vascular disorders.
- Peripheral vascular reactions to smoking–profound vasoconstriction by atherosclerosis.
- Intraoperative thermographic monitoring during neurogenic thoracic outlet decompressive surgery.
Thermographic Assessment of a Vascular Malformation of the Hand: A New Imaging Modality.
Hardwicke JT, Titley OG ABSTRACTVascular malformations of the hand are rare. Angiography is the current Gold Standard imaging modality. Thermal imaging is an emerging noninvasive, non-contact technology that does not require intravenous contrast agents. We present the case of a patient with an arteriovenous malformation affecting the hand in which thermal imaging has been used as an adjunct to capture baseline images to allow monitoring of progression. We suggest that thermal imaging provides an adjunct that can be used in addition to clinical examination and/or angiography for the diagnosis and routine follow-up of conservatively managed arteriovenous malformations, to monitor progression or vascular steal, and also for recording recurrence after surgical excision for which there is known to be a significant incidence. With the benefit of being a noninvasive imaging modality that does not require intravenous contrast, or ionizing radiation exposure, office-based thermal imaging may become commonplace.
www.ncbi.nlm.nih.gov/pubmed/27195175Infrared thermal imaging as a novel evaluation method for deep vein thrombosis in lower limbs.
Deng F, TangQ, Zheng Y. Zeng G. Zhong N , State Key Laboratory of Respiratory Disease, The First Affiliated Hospital of Guangzhou Medical College, Guangzhou 510120, China.
Purpose
Early detection of deep vein thrombosis (DVT) is critical to prevent clinical pulmonary thromboembolism. However, most conventional methods for diagnosing DVT are functionally limited and complicated. The aim of this study was to evaluate the value of infrared-thermal-imaging (IRTI), a novel imaging detection or screening technique, in diagnosis of DVT in animal models.
MethodsDVT model of femoral veins was established in nine New Zealand rabbits. The right hind femoral vein was embolized and the contralateral one served as a nonembolized control. Measurements of IRTI, compression ultrasonography (CPUS), and angiography under ultrasonic observation (AGUO) were performed at three time points: T1 (baseline, 10 min prior to surgery), T2 (2 h after thrombin injection), and T3 (48 h postoperatively). Qualitative pseudo color analysis and quantitative temperature analysis were performed based on mean area temperature (Tav) and mean curvilinear temperature (Tca) of the region of interest as shown in IRTI. Temperature differences (TD) in Tav (TD(Tav)) and Tca (TD(Tca)) between the DVT and control sides were computed. Comparative statistical analysis was carried out by paired t-test and repeated measure, while multiple comparisons were performed by using Greenhouse-Geisser and Bonferroni approach. Values of P < 0.05 and P < 0.01 were considered statistically significant and highly significant.
ResultsModeling of DVT was successful in all rabbits, as confirmed by CPUS and AGUO and immediately detected by IRTI. IRTI qualitative analysis of pseudo color revealed that the bilateral temperatures were apparently asymmetrical and that there were abnormally high temperature zones on the DVT side where thrombosis formed. The results of paired t-test of Tav and Tca between DVT side and control sides did not reveal statistical difference at T1 (Tav: P = 0.817; Tca: P = 0.983) yet showed statistical differences at both T2 (Tav: P = 0.023; Tca: P = 0.021) and T3 (Tav: P = 0.016; Tca: P = 0.028). Results of repeated measure and multiple comparisons of TD(Tav) and TD(Tca) were highly different and significant differences across the T2 (TD(Tav): P = 0.009; TD(Tav): P = 0.03) and T3 (TD(Tav): P = 0.015; TD(Tav): P = 0.021).
ConclusionsIRTI temperature quantitative analysis may help further detection of DVT. Additionally, IRTI could serve as a novel detection and screening tool for DVT due to its convenience, rapid response, and high sensitivity.
www.ncbi.nlm.nih.gov/pubmed/23231273Digital thermography of the fingers and toes in Raynaud’s phenomenon.
Lim MJ, Kwon SR, Jung KH, Joo K, Park SG, Park W. ABSTRACTThe aim of this study was to determine whether skin temperature measurement by digital thermography on hands and feet is useful for diagnosis of Raynaud‘s phenomenon (RP). Fifty-seven patients with RP (primary RP, n = 33; secondary RP, n = 24) and 146 healthy volunteers were recruited. After acclimation to room temperature for 30 min, thermal imaging of palmar aspect of hands and dorsal aspect of feet were taken. Temperature differences between palm (center) and the coolest finger and temperature differences between foot dorsum (center) and first toe significantly differed between patients and controls. The area under curve analysis showed that temperature difference of the coolest finger (cutoff value: 2.2℃) differentiated RP patients from controls (sensitivity/specificity: 67/60%, respectively). Temperature differences of first toe (cutoff value: 3.11℃) also discriminated RP patients (sensitivity/specificity: about 73/66%, respectively). A combination of thermographic assessment of the coolest finger and first toe was highly effective in men (sensitivity/specificity : about 88/60%, respectively) while thermographic assessment of first toe was solely sufficient for women (sensitivity/specificity: about 74/68%, respectively). Thermographic assessment of the coolest finger and first toe is useful for diagnosing RP. In women, thermography of first toe is highly recommended.
Vascular surgical society of great Britain and Ireland: analysis of cold provocation thermography in the objective diagnosis of the hand-arm vibration syndrome.
Coughlin P, Chetter IC, Kent PJ, Kester RC; St James’s University Hospital, Leeds, UK.
BACKGROUND
The hand-arm vibration syndrome (HAVS) is the commonest prescribed disease in the UK. Presently the diagnosis is subjective and the need for an objective investigation to support the diagnosis has been highlighted. This study analyses the potential of cold provocation thermography (CPT) to fulfill this role.
METHODS
CPT was performed in ten controls (five men, five women; median age 35 (range 24-78) years) and 21 patients with HAVS (20 men, one woman; median age 45 (range 29-81) years). With an infrared camera, a pre-cooling (PC) image was taken and then, following hand cooling in water at a temperature of 5 degrees C for 1 min, further rewarming images were taken every minute for 10 min.
RESULTS
Patient finger tip temperatures were significantly cooler than control temperatures at all time points (P < 0.01, Student’s t test). The following Table shows the sensitivity, specificity and PPV of CPT.
CONCLUSION CPT provides strong objective evidence to support the clinical diagnosis of HAVS.
http://www.ncbi.nlm.nih.gov/pubmed/10361321Detection of dialysis access induced limb ischemia by infrared thermography in children.
Novljan G, Rus RR, Koren-Jeverica A, Avčin T, Ponikvar R, Buturović-Ponikvar J. Departments of Pediatric Nephrology, University Medical Centre Ljubljana, Ljubljana, Slovenia. gregor.novljan@mf.uni-lj.si
AbstractHigh arteriovenous fistula (AV fistula) blood flow may impair distal limb perfusion and cause irreversible ischemic damage. Since tissue temperature reflects blood perfusion, we tried to assess distal blood flow using an infrared camera. We examined all 12 patients with an AV fistula in our dialysis unit. Seven were pediatric patients aged 11.0-18.9 years (mean 14.9 years) and five were adults aged 26.9-62.1 years (mean 38.6 years). Infrared thermal imaging (thermography) of their hands was performed after the completion of their regular dialysis sessions. In each patient, the spot temperature of each fingertip on both hands was assessed separately, with three measurements being performed for each measuring point. The mean spot temperature of all fingertips was calculated for each hand and the results compared. A statistically significant difference (P < 0.05) indicated distal perfusion insufficiency. Perfusion of the hands was also assessed by inspecting the visualized temperature distribution on the thermal image. Finally, we compared the results to the clinical findings in relevant patients. In 8/12 patients (66.7%), the mean spot temperature of the fingertips was statistically significantly lower on the fistula side (P < 0.05). Only 4/12 patients (33.3%) had clinical symptoms, and all were detected by thermography. Abnormal findings were more frequent in elderly patients. Although we realize that the diagnosis of steal syndrome is primarily clinical, thermography might be a safe, noninvasive, cheap tool for the timely detection of children at risk of developing symptoms of hand ischemia.
© 2011 The Authors. Therapeutic Apheresis and Dialysis © 2011 International Society for Apheresis.
http://www.ncbi.nlm.nih.gov/pubmed/21624080Infrared thermal imaging for detection of peripheral vascular disorders
Bagavathiappan, T. Saravanan, John Philip, T. Jayakumar, Baldev Raj, R. Karunanithi, T. M. R. Panicker, M. Paul Korath, and K. Jagadeesan Abstract Body temperature is a very useful parameter for diagnosing diseases. There is a definite correlation between body temperature and diseases. We have used Infrared Thermography to study noninvasive diagnosis of peripheral vascular diseases. Temperature gradients are observed in the affected regions of patients with vascular disorders, which indicate abnormal blood flow in the affected region. Thermal imaging results are well correlated with the clinical findings. Certain areas on the affected limbs show increased temperature profiles, probably due to inflammation and underlying venous flow changes. In general, the temperature contrast in the affected regions is about 0.7 to 1° C above the normal regions, due to sluggish blood circulation. The results suggest that the thermal imaging technique is an effective technique for detecting small temperature changes in the human body due to vascular disorders. Introduction The correlation of body temperature and diseases has been known for centuries, but in recent years, due to advent of new technologies, skin temperature has been used as a convenient and effective diagnostic tool to detect diseases.[1–2] Human body temperature has been recorded with thermocouples, thermistors, and thermopiles, for almost 60 years, and these sensors are very large in size, slow in response, and difficult to attach to the skin.[3] The first documented application of thermography was a method of research for early preclinical diagnosis of breast cancer in the year 1956.[4] Infrared thermography or infrared imaging or thermal imaging is a non-contact tool, which maps the surface temperature of a body or an object and it has a wide range of applications starting from condition monitoring in industries to medical imaging.[5–9] Medical infrared thermal imaging has been used to study the flow of blood, the detection of breast cancer, and muscular performance of the human body.[10,11] Thermal images have been used to quantify sensitive changes in skin temperature in relation to certain diseases.[12] Blood flow can be assessed by many methods including the washout technique, laser Doppler flowmetry,[13] and medical infrared thermal imaging.[14] Of these, infrared thermography has the advantages of being noninvasive,[15] fast, reliable, with non-contact, capable of producing multiple recordings at short time intervals, and absolutely safe for patients and doctors. In all these studies, only the relative and not absolute temperatures are significant and the relative temperatures have to be measured at many points on the skin, and in this sense, the Infrared (IR) sensing device has many advantages over conventional devices.[16,17] IR radiation covers a wavelength that ranges from 0.75μm to 1000μm, among which the human body emissions that are traditionally measured for diagnostic purposes occupy a narrow band of wavelengths ranging from 8μm to 12μm. This region is also referred as the long wave IR (LWIR) or body infrared rays. Another terminology that is widely used in medical IR imaging is thermal infrared (TIR), where the wavelength is beyond 1.4μm. Within this region, the infrared emission is primarily heat or thermal radiation. The image generated by TIR imaging is referred to as thermogram. The near infrared (NIR) region occupies wavelengths between 0.75μm and 1.4μm. Although the NIR and mid-wave IR (MWIR) regions are not traditionally used in human body screening, the new generation detectors enable the use of multispectral imaging in medicine, in which these regions are observed in different diagnostic cases.[18,19] The fundamental equations that link the absolute temperature of the object with the intensity and wavelength of the emitted radiation are given by the Planck’s, Stefan Boltzmann, and Wein’s Displacement law.[20] The energy radiation after Stefan Boltzman law is W = ɛ σ T4, where ɛ is the emissivity and T the absolute temperature. The emissivity (ɛ) of a material is the ratio of energy radiated by a particular material to the energy radiated by a black body at the same temperature. It is a measure of a material’s ability to radiate absorbed energy. A true black body would have an emissivity value of unity (ɛ = 1), while any real object would have ɛ < 1. Emissivity depends on factors such as, temperature, emission angle, and wavelength. For a black body the total heat energy radiation is proportional to T4. A perfect black body is a perfect emitter and a perfect absorber for all wave length energies radiated, depending on the temperature of the material. Human skin keeps the body temperatures normally at 37°C. When the skin is in cooler surroundings, it cools down, emitting heat. Similarly when skin is in warmer surroundings, it absorbs heat making the body adjust itself by sweating, to keep the temperature at 37°C. In both situations, therefore, the skin acts like a black body with emissivity of 0.98, as observed. It has been shown that the emissivity of skin (black, white, burnt, male, and female) independent of the wavelength and its value is close to 0.98.[21–23] Therefore, human beings can be treated as true black bodies. The infrared radiations from the object are converted using a suitable IR detector and displayed as color or black and white image. The colors are simply a visual aid to show the temperature differences at different regions in each image.[24] Medical infrared diagnostics uses the fact that many pathological processes in the human organs manifest themselves as local changes in heat production and also as changes in the blood flow pattern of the affected organs or tissues. Infrared thermography involves recording a sequence of thermograms at several stationary positions of the human being, inspected in his natural condition. Focal plane array (FPA) based systems are more efficient for medical applications than systems previously using single element detectors.[25–27] In clinical diagnostics infrared imaging is used as a physiological test that measures the subtle physiological changes that might be caused by many conditions, e.g., contusions, fractures, burns, carcinomas, lymphomas, melanomas, prostate cancer, dermatological diseases, rheumatoid arthritis, diabetes mellitus and associated pathology, deep venous thrombosis (DVT), liver disease, bacterial infections, etc. These conditions are commonly associated with regional vasodilation, hyperthermia, hyperperfusion, hypermetabolism, and hypervascularization [18] which generate a higher-temperature heat source. The heat emanating onto the surface from the heat source and the surrounding blood flow can be quantified by using the Pennes’ bio-heat equation, as follows, kΔ2–cbwb(T–Ta)+qm=0 (1) Where k is the conductivity, qm is volumetric metabolic rate of tissue, is the product of the specific heat capacity and the mass flow rate of blood units per volume of tissue, T is the unknown tissue temperature, and Ta is the arterial temperature.[21] Materials and Methods The patients were allowed to rest in a room where relative humidity and room temperature were controlled (to achieve equilibration body temperature with the ambient temperature). No parts of the patient were in contact with any hot or cold sources. Only a minimum number of persons were allowed inside the room. The patients were kept away from air convection sources. These precautions had been taken to minimize the variables that might influence temperature measurement. The main objective in the preparation of the above protocol was to ensure all the variables that might have influence during thermal image were fixed. The patient was thoroughly examined by a team of doctors and a clinical report was recorded. Patients undergoing examination by thermal imaging were disrobed in the affected region for 15 minutes, in the room. A wall–mounted, air-conditioning unit provided the required temperature inside the room. The infrared thermal camera was positioned 1 m away from the affected portion of the patients and healthy volunteers. Standard views were taken with the camera mounted on a tripod stand. The regions of interest were the anterior, posterior, and lateral views. The same views of the corresponding contra-lateral region of the patient and of normal controls were also taken. The same region was continuously monitored on a color display unit with pseudo color, making temperature changes easily discernible. Thermal imaging of the patients was carried out using the Thermovision-550 system. This is a compact lightweight focal plane array based system with a temperature resolution of 0.1K. A high-resolution color image is provided in real time, which can be viewed on a miniature screen provided with the system or by using an external monitor. The image is captured and stored in the removable PC-card. The surface temperature profiles of the patients are recorded and later analyzed using the IRWIN software. The thermal profile of the area of examination is compared with the counterpart region of the same subject and the same region of a healthy volunteer. Using the spot meter, area, and profiling tools, the change in temperature in the region of interest is determined. Results and Discussions Case 1 A 28-year-old male, with a history of pain in the left lower limb, which was getting aggravated on prolonged standing, was examined using thermal imaging. He had varicosity of the long saphenous system of the left lower limb. The patient was suffering from complications of varicosity for the past one year. He was using crepe bandages. The patient was febrile and comfortable at rest and was not a smoker or user of alcohol. The respiratory system (RS), cardiovascular system (CVS), central nervous system (CNS), and per abdominal examinations were normal. Local examination of the lower limbs showed dilated veins present in the dorsal aspect of the foot, extending up to the lower one-third of the leg on the right lower limb. There were dilated tortuous veins in the dorsum of the foot in the left lower limb. The radial pulse, carotid pulse, dorsalis pedis, and posterior tibial pulse were normal. Figure 1a and 1b show the thermal image and photograph of the affected patient’s left leg. The line profile inset in Figure 1a shows the temperature profile along the toe tips. From the thermal image shown in Figure 1a, it can be clearly seen that a lower temperature is noted at the distal portion (indicated by white arrow in Figure 1a). This is probably due to sluggish blood circulation in the toes and venous drainage being inadequate due to the varicosity. In the patient, the area outlined by a black line, i.e., the demarcated dark-green patches, and a blue line, i.e., the demarcated pale-green color patch [Figure 1a] show abnormal temperatures compared to the temperature of the surrounding area of the same patient’s leg and to that of a normal person’s leg. The temperature in these marked regions is, on an average, 0.7 to 1°C above the normal regions. The abnormal temperature is due to varicose veins, with probable mild inflammation, which was not evident on clinical examination. The human body creates heat through the metabolic activity, which is the basic reaction of life. The blood in the near-surface veins, heats the surface more than the normal veins and arteries. Localized elevated temperatures are easier to discern when the person is in a cool room for at least 20 minutes. A uniform temperature can be seen in the leg of a normal person.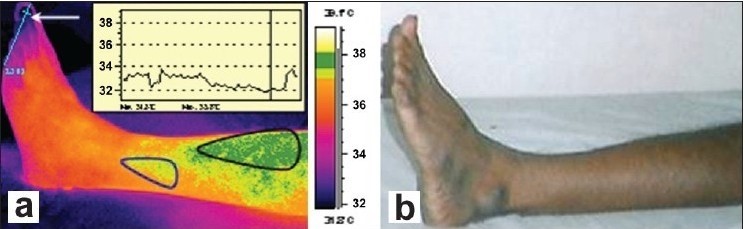 (a) Isothermal image and (b) Photograph of the affected patient’s leg
Case 2
A 31-year-old male, who has a history of swelling in both the lower limbs on prolonged standing, for five years, had recurrent ulceration over the left lateral malleolus, associated with pain and discharge of pus. The patient underwent treatment and surgery four years back, for the same complaint. The RS, CVS, CNS, and per abdominal examinations were normal. Local examination of the left lower limb showed tortuous dilated veins, recurrent healing ulcers on the left lateral malleolus, ulcers covered with slough and pus discharge. Old healed scars were about 8 × 1 cm in length, present in the medial aspect of the lower limb. In the right lower limb, dilated tortuous veins, mild edema over the right ankle joint, and also old healed scars were noticed. The palpable arterial pulse was normal. The patient had systemic hypertension noted six months ago and he was under medication for the same.
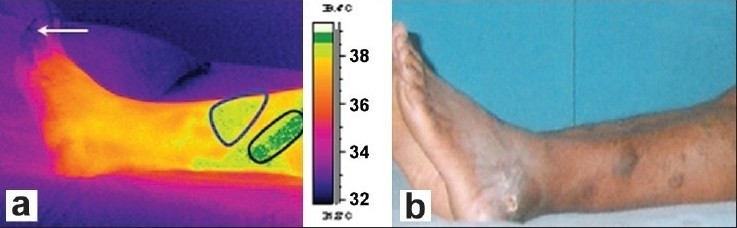
Figure 2a and 2b show the dorsal thermal images and photograph of the affected patient’s left leg. Clinically detected areas with varicosity show up as areas of increased warmth in the thermal images. From the thermal images, the warm areas are noted on the lateral side of the left leg as well, an unusual finding, because most patients have varicosity located only on the medial side of the leg. The distal region near the toes seems to be dark or with lower temperature due to the poor perfusion of blood (indicated by a white arrow in Figure 2a, and is attributed to stasis of circulation due to varicosity.
(a) Isothermal image and (b) Photograph of the affected patient’s leg
Case 2
A 31-year-old male, who has a history of swelling in both the lower limbs on prolonged standing, for five years, had recurrent ulceration over the left lateral malleolus, associated with pain and discharge of pus. The patient underwent treatment and surgery four years back, for the same complaint. The RS, CVS, CNS, and per abdominal examinations were normal. Local examination of the left lower limb showed tortuous dilated veins, recurrent healing ulcers on the left lateral malleolus, ulcers covered with slough and pus discharge. Old healed scars were about 8 × 1 cm in length, present in the medial aspect of the lower limb. In the right lower limb, dilated tortuous veins, mild edema over the right ankle joint, and also old healed scars were noticed. The palpable arterial pulse was normal. The patient had systemic hypertension noted six months ago and he was under medication for the same.
Figure 2a and 2b show the dorsal thermal images and photograph of the affected patient’s left leg. Clinically detected areas with varicosity show up as areas of increased warmth in the thermal images. From the thermal images, the warm areas are noted on the lateral side of the left leg as well, an unusual finding, because most patients have varicosity located only on the medial side of the leg. The distal region near the toes seems to be dark or with lower temperature due to the poor perfusion of blood (indicated by a white arrow in Figure 2a, and is attributed to stasis of circulation due to varicosity.
 (a) Isothermal image and (b) Photograph of the affected patient’s leg (Dorsal view)
Areas outlined by black lines, i.e., the demarcated dark-green patch and blue line, i.e., the demarcated pale-green color patch in Figure 2a show abnormal temperature compared to the temperature of the normal person’s leg, for the same region. The demarcated area in the thermal image shows a higher temperature due to the tortuous venous carrying warm blood at a sluggish speed when compared to normal venous drainage and probable mild inflammation in those areas. The temperature changes as noted on the patient are not seen in the leg of the normal person.
Case 3
A 48-year-old male has had pain in the left leg (calf muscle) for the past two years. The pain has been severe for the past six months. He has had a history of pain aggravation on walking and pain being relieved by rest. On prolonged standing the pain increased. The RS, CVS, CNS, and per abdominal examinations were normal. The upper limb pulses were felt normally in the right and left lower limbs, the dorsalis pedis was normal in the right, with feeble low volume in the left lower limb, and the posterior tibial pulse was normal on the right, with low volume on the left. The patient is an occasional smoker and user of alcohol. There was an injury in the left big toe eight months ago. He had a nonhealing ulcer on the left great toe and gangrenous tissue was found on the great toe.
From the thermal images, the left leg medial view of the patient shows elevated temperatures because of thrombosis, a condition marked by blood clotting within the blood vessels. This disease may be potentially life threatening if dislodgment of the thrombus results in pulmonary embolism. It may be burger disease because of arterial insufficiency. It is an arterial obstruction. The clinically recorded information shows severe pain in the calf muscle, the area represented in the thermal image as a warm area shows abnormal temperature compared to the temperature of the normal person’s leg, for the same region. These temperature changes are not seen in the thermal image of the normal person’s left leg.
Case 4
A 40 year-old-male had a swelling in the little finger of the left hand that was two months old. The swelling was present with a pricking type of pain and pus discharge from the left ring, middle, and index fingers. Pain was radiating from the left hand and forearm to the left chest and distal phalanges. The RS, CVS, CNS, and per abdominal examinations were normal. Local examination of the patient’s right upper limb was normal. The left upper limb on inspection showed gangrenous swelling with inflammation in the left little, ring, middle, and index fingers. There was purulent discharge from the nail beds that had a foul smell. There was hyperpigmentation present in the left palm. The patient was a smoker for the past 10 years (10 – 15 beedis per day), and an occasional user of alcohol. He has no history of any surgery in the past. Due to pain he was unable to sleep and has had a reduced appetite.
From the thermal images it is clearly seen that the temperature of the fingertips of the left hand is cooler than the normal body temperature, which may be attributed to vascular insufficiency. These abnormalities are due to ischemic necrosis (death of tissue affected by local injury due to loss of blood supply) of the distal phalanges. It can be seen that the temperature increase in the affected person’s hand was almost 1.5°C compared to the normal hand.
Conclusions
Thermal imaging has been successfully used for medical diagnosis of vascular disorders. The temperature in the affected regions of patients with vascular disorders was low in the extremities due to obstructed arteries. However, in some areas it showed 0.7 to 1°C higher temperature than the normal areas due to inflammation and venous flow alteration. In general, the thermal image findings were in good agreement with the clinical findings. However, the areas showing higher temperature contrast were noted not to be obvious in the clinical examination. This study demonstrates the usefulness of thermal imaging for medical diagnostics, with high reliability.
Acknowledgments
We thank Dr. P. R. Vasudeva Rao, Director, Metallurgy and Materials group, IGCAR, for his support and encouragement. The authors also thank Dr. Hussain, Head of the Department and Dr. Rajkumar, Surgeon, Department of Vascular Surgery, Government General Hospital, Chennai, for referring the problem.
Footnotes
Source of Support: Nil
Conflict of Interest: None declared.
References
(a) Isothermal image and (b) Photograph of the affected patient’s leg (Dorsal view)
Areas outlined by black lines, i.e., the demarcated dark-green patch and blue line, i.e., the demarcated pale-green color patch in Figure 2a show abnormal temperature compared to the temperature of the normal person’s leg, for the same region. The demarcated area in the thermal image shows a higher temperature due to the tortuous venous carrying warm blood at a sluggish speed when compared to normal venous drainage and probable mild inflammation in those areas. The temperature changes as noted on the patient are not seen in the leg of the normal person.
Case 3
A 48-year-old male has had pain in the left leg (calf muscle) for the past two years. The pain has been severe for the past six months. He has had a history of pain aggravation on walking and pain being relieved by rest. On prolonged standing the pain increased. The RS, CVS, CNS, and per abdominal examinations were normal. The upper limb pulses were felt normally in the right and left lower limbs, the dorsalis pedis was normal in the right, with feeble low volume in the left lower limb, and the posterior tibial pulse was normal on the right, with low volume on the left. The patient is an occasional smoker and user of alcohol. There was an injury in the left big toe eight months ago. He had a nonhealing ulcer on the left great toe and gangrenous tissue was found on the great toe.
From the thermal images, the left leg medial view of the patient shows elevated temperatures because of thrombosis, a condition marked by blood clotting within the blood vessels. This disease may be potentially life threatening if dislodgment of the thrombus results in pulmonary embolism. It may be burger disease because of arterial insufficiency. It is an arterial obstruction. The clinically recorded information shows severe pain in the calf muscle, the area represented in the thermal image as a warm area shows abnormal temperature compared to the temperature of the normal person’s leg, for the same region. These temperature changes are not seen in the thermal image of the normal person’s left leg.
Case 4
A 40 year-old-male had a swelling in the little finger of the left hand that was two months old. The swelling was present with a pricking type of pain and pus discharge from the left ring, middle, and index fingers. Pain was radiating from the left hand and forearm to the left chest and distal phalanges. The RS, CVS, CNS, and per abdominal examinations were normal. Local examination of the patient’s right upper limb was normal. The left upper limb on inspection showed gangrenous swelling with inflammation in the left little, ring, middle, and index fingers. There was purulent discharge from the nail beds that had a foul smell. There was hyperpigmentation present in the left palm. The patient was a smoker for the past 10 years (10 – 15 beedis per day), and an occasional user of alcohol. He has no history of any surgery in the past. Due to pain he was unable to sleep and has had a reduced appetite.
From the thermal images it is clearly seen that the temperature of the fingertips of the left hand is cooler than the normal body temperature, which may be attributed to vascular insufficiency. These abnormalities are due to ischemic necrosis (death of tissue affected by local injury due to loss of blood supply) of the distal phalanges. It can be seen that the temperature increase in the affected person’s hand was almost 1.5°C compared to the normal hand.
Conclusions
Thermal imaging has been successfully used for medical diagnosis of vascular disorders. The temperature in the affected regions of patients with vascular disorders was low in the extremities due to obstructed arteries. However, in some areas it showed 0.7 to 1°C higher temperature than the normal areas due to inflammation and venous flow alteration. In general, the thermal image findings were in good agreement with the clinical findings. However, the areas showing higher temperature contrast were noted not to be obvious in the clinical examination. This study demonstrates the usefulness of thermal imaging for medical diagnostics, with high reliability.
Acknowledgments
We thank Dr. P. R. Vasudeva Rao, Director, Metallurgy and Materials group, IGCAR, for his support and encouragement. The authors also thank Dr. Hussain, Head of the Department and Dr. Rajkumar, Surgeon, Department of Vascular Surgery, Government General Hospital, Chennai, for referring the problem.
Footnotes
Source of Support: Nil
Conflict of Interest: None declared.
References
- Ring EF. Quantitative thermal imaging. Clin Phys Phsiol Meas. 1990;11:87–95. [PubMed]
- Anbar M, Gratt BM, Hong D. Thermology and facial telethermography, Part I: history and technical review, Dentomaxillo, Fac Radiol. 1998;27:61–7. [PubMed]
- Ring EF. The historical development of temperature measurement in medicine. Infrared Phys Technol. 2007;49:297–301.
- Lawson R. Implications of surface temperatures in the diagnosis of breast cancer. Can Med Assoc J. 1956;75:309–10. [PMC free article] [PubMed]
- Avdelidis NP, Koui M, Ibarra-Castanedo C, Maldague X. Thermographic studies of plastered mosaics. Infrared Phys Technol. 2007;49:254–56.
- Avdelidis NP, Delegou ET, Almond DP, Moropoulou A. Surface roughness evaluation of marble by 3D laser profilometry and pulsed thermography. NDT and E International. 2004;37:571–5.
- Barreira E, Vasco P, de Freitas. Evaluation of building materials using infrared thermography. Constr Building Mat. 2007;21:218–24.
- Grinzato E, Bison PG, Marinetti S. Monitoring of ancient buildings by the thermal Method. J Cultural Heritage. 2002;3:21–9.
- Maierhofer CH, Arndt R. Influence of concrete properties on the detection of voids with impulse-thermography. Infrared Phys Technol. 2007;49:213–7.
- Cook RJ, Thakore S, Nichol NM. Thermal imaging: A hotspot for the future? Injury Extra. 2005;36:395–7.
- Di Carlo A. Thermography and the Possibilities for its applications in clinical and experimental dermatology. Clin Dermatol. 1995;13:329–36. [PubMed]
- Jones BF. A reappraisal of the use of infrared thermal image analysis in medicine. IEEE Trans Med Imaging. 1998 [PubMed]
- Herrick L. Vascular imaging. Best Pract Res Clin Rheumatol. 2004;18:957–9. [PubMed]
- Hsieh JC, Chan KH, Lui PW, Lee TY. Clinical application of infrared thermography in diagnosis and therapeutic assessment of vascular ischemic pain. Ma Zui Xue Za Zhi. 1990;28:493–501. [PubMed]
- Davy JR. Medical applications of thermography. Phys Technol. 1977:54–60.
- Mochi M, Giovanetti G, Francesconi R, Hartwig V. A Study for a portable IR sensor to detect the blood temperature during coronary bypass implantation. Technical Report. 2004
- Bagavathiappan S, Saravanan T, Philip J, Jayakumar T, Baldev R, Karunanithi R, et al. Investigation of peripheral vascular disorders using thermal imaging. Br J Diabetes Vasc Dis. 2008;8:102–4.
- Hairong QI, Nicholas A Infrared Imaging in Medicine. Available from:
- Infrared. Available from: http://en.wikipedia.org/wiki/Infrared.
- Maldague XP. Nondestructive evaluation of materials by infrared thermography. Germany: Springer-Verlag London Limited; 1993.
- Nelson DA. Invited Editorial on Pennes 1948 paper revisited. J Appl Physiol. 1998;85:2–3. [PubMed]
- Steketee J. Spectral emissivity of skin and pericardium. Phys Med Biol. 1973;18:686–94. [PubMed]
- Togawa T. Non-contact skin emissivity: Measurement from reflectance using step change in ambient radiation temperature. Clin Phys Physiol Meas. 1989;10:39–48. [PubMed]
- Zhou Q, Aggarwal JK, Bounday Extraction in Thermal images by edge map, ACM Symposium on applied computing. 2004
- Vainer BG. FPA-based infrared thermography in medicine. Phys Med Biol. 2005;50:R63–94. [PubMed]
- Vainer BG. Narrow spectral range infrared thermography in the vicinity of 3μm operating wavelength, QIRT. 2000
- Vainer BG. FPA-based infrared thermography as applied to the study of cutaneous perspiration and stimulated vascular response in humans. Phys Med Biol. 2005;50:R63–94. [PubMed]